Prisoners Dilemma Project
What is Prisoners Dilemma Game ?
The game played by two player. Players may chose to Cooperate or Defect. So there will be three different scenarios.
- Both cooperate
If both choose to cooperate: Both will get a pay-off of magnitude R (reward)
- Both defects
If both defects both will get a pay-off of P (punishment)
- One cooperate one defects
The one who defects will get a games biggest pay-off which is T (temptation)
The one who cooperate will get a pay-off of S (suckers)
So if the values chosen like : T>R>P>S. The player who chose to play the role of Defect seems to have best strategy but, if player always encounter with the players whose also choose defect, he will be in disadvantage because R>P.
In this paper, they only consider two kind of Players. One of them will be always cooperating while the other type will always defect.The game will be starting like this:
There will be a grid NxN and each cell in that grid will represent a player which might be either 'D' or 'C' . In every round player will play the game with it's neighbours and will the get score from each of it's game. The score of the player will be the sum of the scores that it get from it's neighbours. At the start of the next generation, the owner of cell will be decided by the checking highest score among the previous owner and its neighbours.
They did not mention this in the paper but, after each generation scores should be resetted otherwise those figures can not be obtained.
By the way, when they say neighbours it means 8 adjustgent cell. UP,DOWN,LEFT,RIGHT,UP_LEFT,UP_RIGHT,DOWN_LEFT,DOWN_RIGHT
Each type of player will have different color as it can be seen from the figure above.
- Currently D and Previously also D ones will be Red
- Currently D but Previously C ones will be Yellow
- Currently C and Previously also C ones will be Blue
- Currently C but Previously D ones will be Green
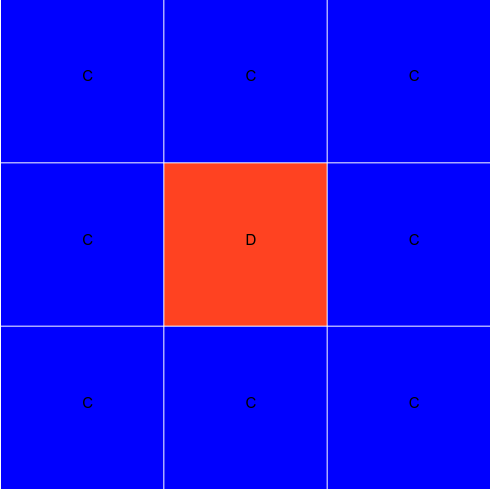
Here is the example how game works with simple 3x3 grid and when the T=1.75. In Figure 1, there is only one D and the rest is C. Since all of D's neighbours are C. from each of them it will get T. So the score will be Score = 8*T => 8*1.75 = 14. This will be the highest score for 3x3 grid, since the D is at the center all of the C's score will be lower than this, because they will get punishment.
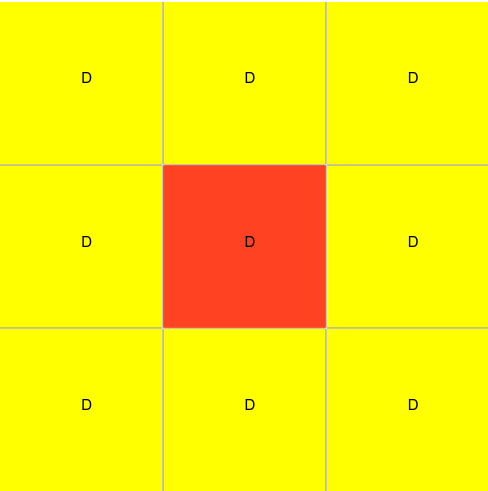
After first generation, all of the neighbours of the D's at the center will be converted to defect too. Since these news defects were previously cooperators, they will be represented with different color like Yellow.
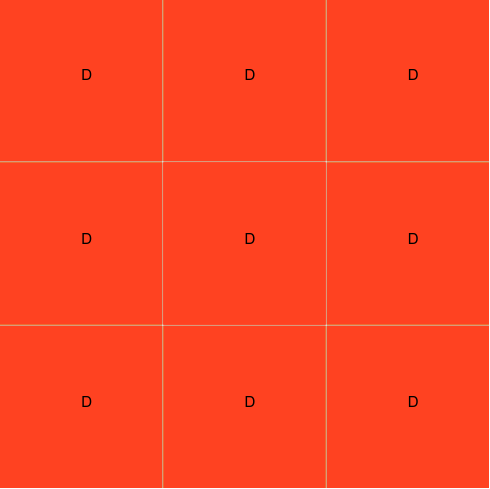
Another generation later, whole grid will be covered with Red because of their Score dominances.
Here is the first part of project. It can be also used as homework 14.
For the first two Figure in the paper. They started game in a 200x200 grid. Each cell in that grid randomly assigned to be either Defect 'D' or Cooperator 'C'. Defect rate was %10. The Following figure shows the initial distribution of D and C.


The image above created with on a 200x200 grid with 10% defect rate b = 1.76 when the time step is 200.

The image above created with on a 200x200 grid with 10% defect rate b = 1.86 when the time step is 200.
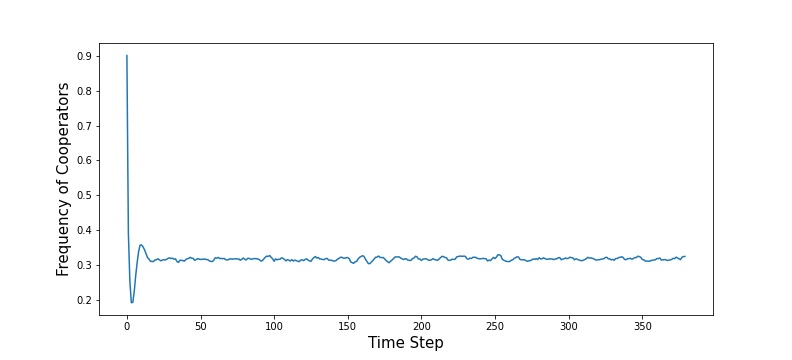


As it can be seen from the figures above. Even with the different initial Defect (Cooperator) rates, frequiencies of Cooperators yields to the same value fc = 0.3.
Images in the Paper
Following figures obtained and they are identical to the figures represented in the paper.
- Grid Size : 99x99
- Only one Defect at the center (row:50, col:50)
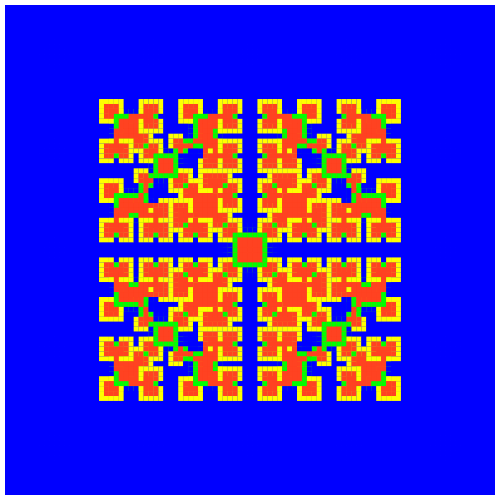

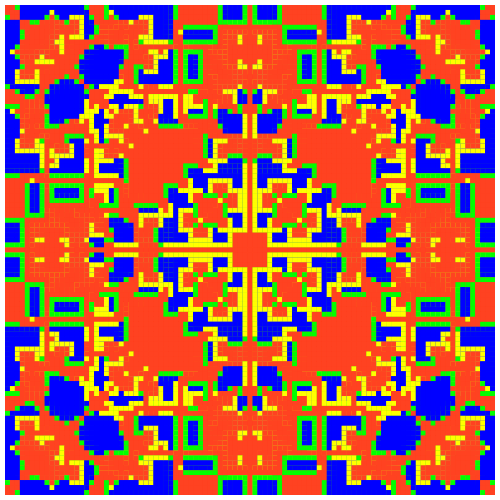

Here some examples with Grid Size:99x99 and one defect at center at different time steps. It seems like this approach generates infinite figures like this.